Friday, August 22, 2014

Raspberry Pi controlled LEDs that tell me if a server is offline

A friend of mine who is also a sysadmin recently said to me that if a device he managed went offline, red alarm lights went off in his office.

He meant it as a figure of speech but I thought that would actually be an awesome addition for my server shelf so I would know if there is a problem with the server or one of its virtual machines.
I bought a roll of RGB LED strips from Amazon and connected them to a few relays that were controlled by  a simple ping script on my raspberry pi.

Here is how it looks:

Cut LED strip that is mounted above Server 2

Strip in front of Server 1
Cable management is yet to come


This is how it looks if Server 1 has an error but Server 2 is fine. Only after I installed it I realized that the red LEDs are much weaker than the green ones. But it's okay and you can see if fine even if the sun shines in.

One offline, the other one online


Both are online

Here are my schematics:

And the breadboard schematics:


Thursday, July 24, 2014

IKEA Server Rack (nope not that LACK thing)

I moved recently and had the most geeky problem there is: Where do I put my servers and the coffee maker?

I've read a lot of things about Lack Racks, where people use the 7€ LACK table from IKEA to mount rackmountable servers.

But since I have neither a rackmountable server nor the table at home I had to think of something else to house my two servers.

I did however have an old KALLAX (former EXPIDIT) shelf and this is how I built it:

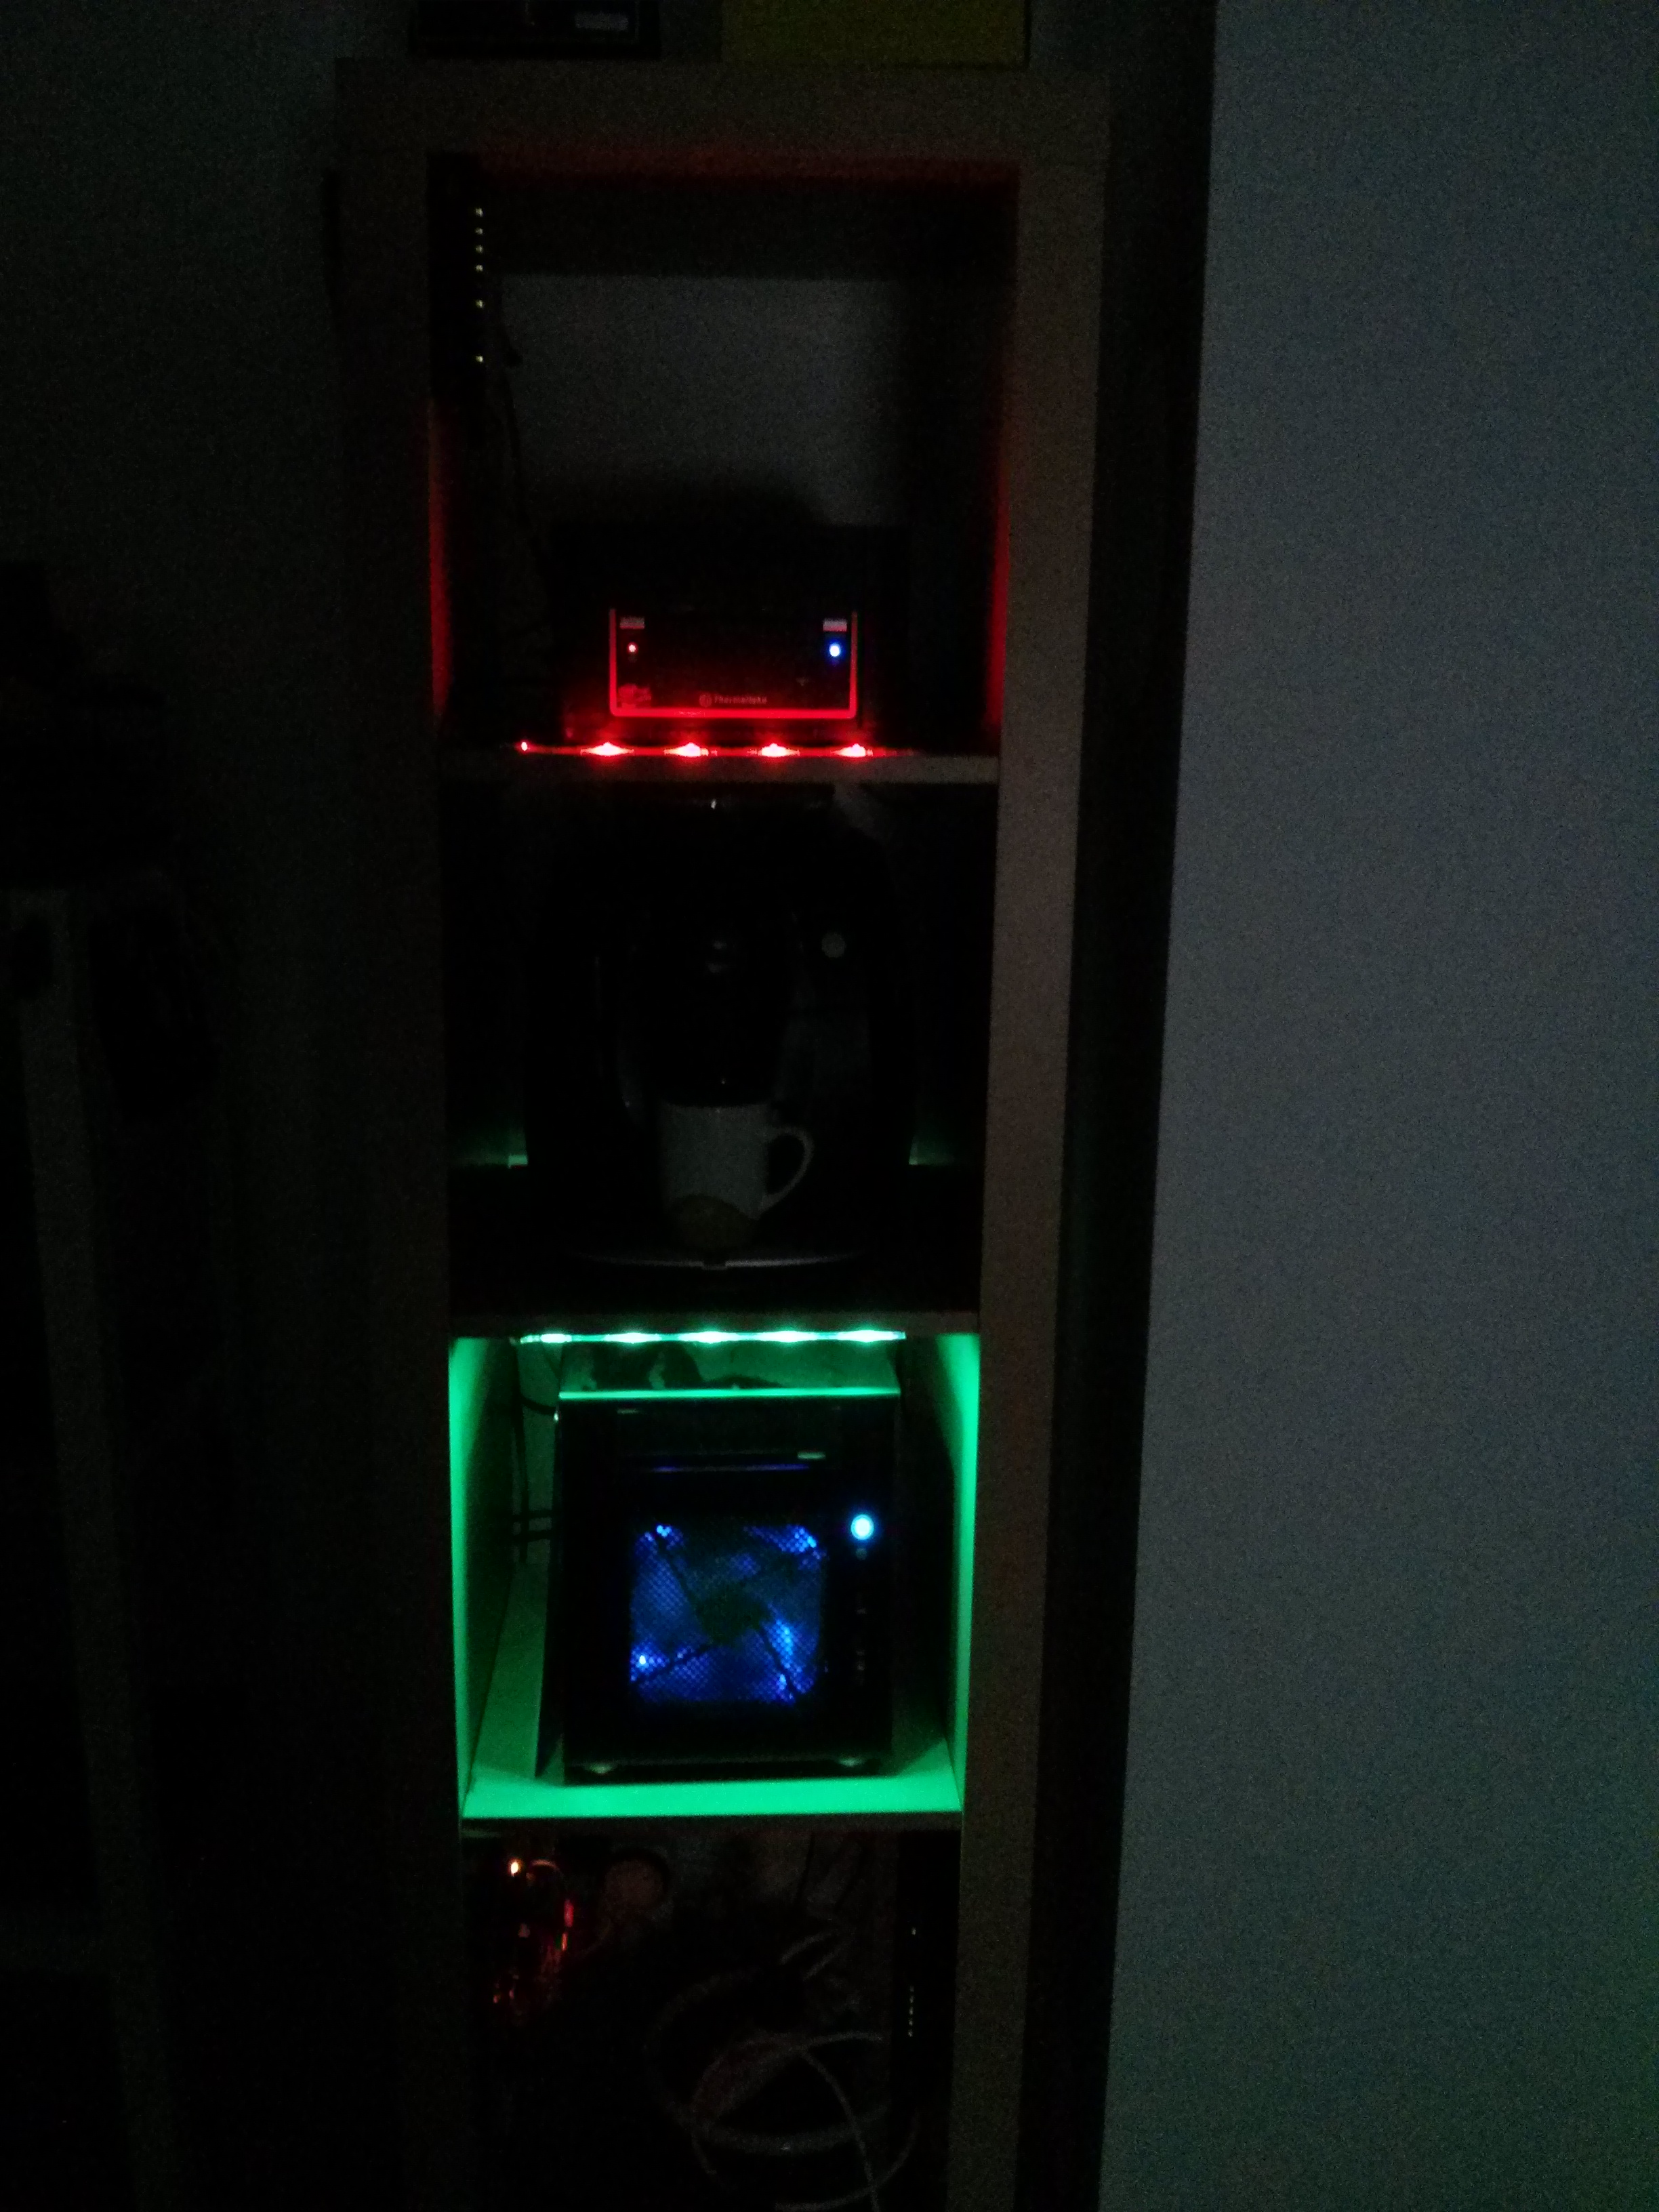
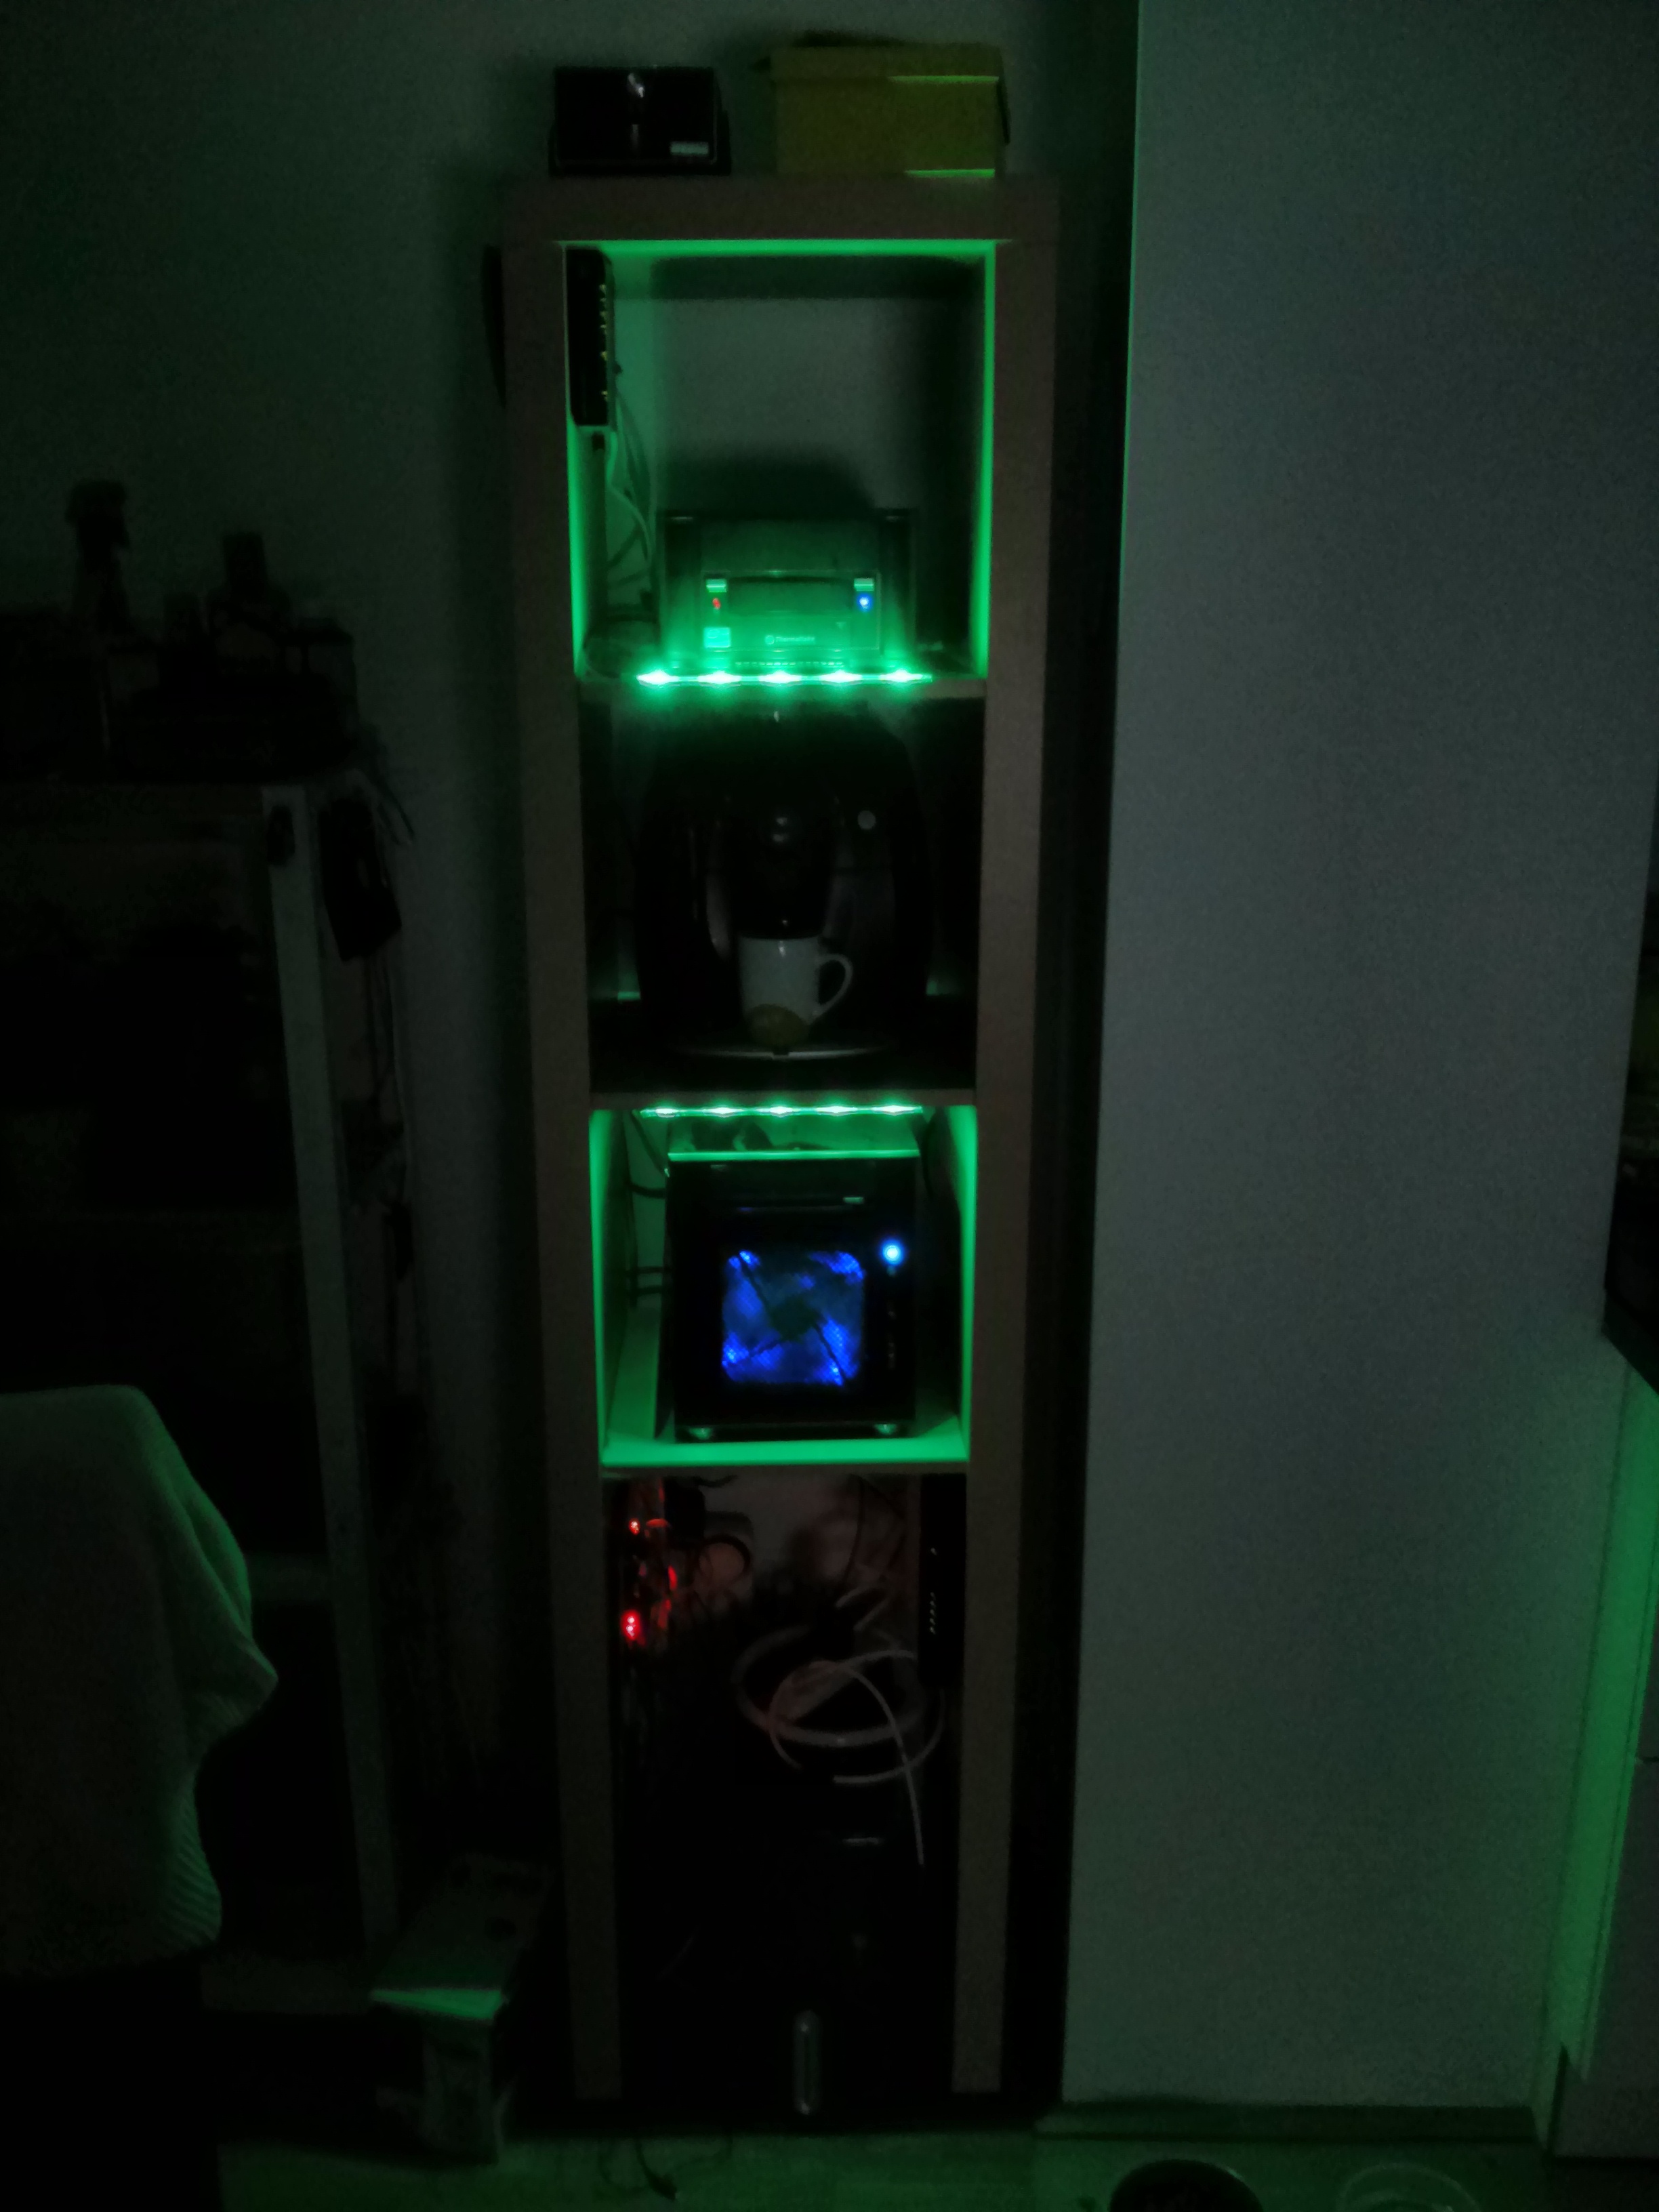
For the impatient here is the final result:


And here is how I made it:

Cable management

For cable management I was using pipe holders since they are much cheaper than any solution that had "cable" or "management" in their names. These are about 4 Cents (€ cents) a piece (2€ for a bag of 22 pieces). I mounted them with one screw per holder because this way I'm able to add/remove cables without needing to unscrew the whole thing.


Rack on roller skates

Since I know I have to change cables every now and then I felt the need to mount some kind of rolls to the bottom of the rack so I can move it easily without any danger to the servers. So I picked up a few furniture rollers and mounted them with some screws


Modem and router

I've been provided a Thompson modem/router from my ISP. This thing really really sucks so I bought an additional router and configured the modem to be just a modem and let my router do all the routing :D

I installed the modem sideways in the lowest segment so I can easily check the LEDs and reset it if it doesn't do what it's told.


Since my Linksys router is also my AP I mounted it on the top left side of the self


Fitting the Servers

Here you can see the pipe holders with one screw each. I've but the NAS in for fitting


And added the power cables and the Xeon server


The Switch

To connect all devices I bought a Cisco 8 port Gigabit smart switch that can be mounted nicely next to the Xeon server.

At this point I realized that the switch's power cable has to be connected on it's side. Nope.. not the side facing down -.-


Much better here!


The pipe holders are doing their job like they've never done anything else in their lifes!


The finished server shelf


The coffee maker fits in place perfectly and since it's not used very often I don't think the steam will affect any of the servers.

Let me know, what you think about this project!
submit to reddit

Sunday, May 25, 2014

Raspberry Pi controlled power sockets - It's pretty easy

Ever since I started working on small projects with my raspberries I wanted to control something bigger than an LED. I played around with relays for some time but I always cut the cable (eg from a lamp) and connect the power line through the relay but for that I had to cut (and uglify) a stock cable.

A friend got me the idea of simply connecting a power socket to the relay so I can plug in what ever I want withoug having to modify it.

So I've built it and mounted everything on a piece of wood.

I used:

  • 3 Power sockets for 2€ each
  • a Power cable to power the sockets for 2€
  • an 8 port relay board for 6€
  • Since my female jumper cables I ordered a week ago didn't arrive yet I used some other wires
The base components screwed on a piece of wood

The power sockets are connected


All connected and ready to go.
This just just a proof of concept, if it works out I'll build it in a nicer (and safer) case

The last step was the software. I used the php-gpio library and built a simple webpage so I can control the sockets from my phone (or PC)


I connected my self made plant-shelf and a small fan to the sockets to the power sockets and gave it a try.


Here you can see it in action


Tuesday, May 6, 2014

DIY hydroponic pot for about 36€

So this is my first non-IT post on my blog and I hope it will help somebody save a few bucks.

One of my hobbies besides programming and teaching is gardening. I recently bought a hydroponic pot that automatically waters the plant for about 60€ and it worked amazingly well with lettuce:


But since it uses a very simple principal I thought 60€ are a bit much for that so I decided to make my own.

Thanks to my awesome Gimp 2.8 skills I was able to produce this paint-like schematic of what I'm going to build and how it should work:

There are actually two possible solutions for transporting the water to the surface. I chose a water pump but it would work equally well with a small aquarium-air pump that would be connected to the hose aboth the water level.

You'll need those things:
  • A planter (pot without holes)
  • A smaller flower pot that should not touch the ground of the planter - I used a flower bowl (didn't even know those things existed)
  • 1m garden/aquarium hose
  • 1 T-piece for the hose
  • An aquarium water pump
  • Hydroballs

I picked up everything for 36€ (about 49$)

These are european prices btw so in the US the parts should be much cheaper. It probably will cost you only 30 bucks or so

Enough of the theory.. let's build it!

All the parts

I had to drill some small holes in the bottom fot the water
and a bigger one for the hose

The bowl fits and the hose seems also pretty tight

Attach a short piece of hose to the pump

and put it under the bowl in the pot

Form a ring from some hose and make small holes in it

Stick it on the bowl-hose

Put the soil in and in my case a small pumpkin and we're finished

The plants really seem to love this kind of pot as you can see in the first pic of the lettuce. The last picture shows the young pumpkin plant. A few days later under fluorescent lights it looked like this:


I'll try to make a few more of them. Maybe I'll be able to make a cheaper or more effective version of this pot.

Tuesday, February 11, 2014

Visualizing the temperature from 6 months

In my last project I used a Raspberry Pi and a few temperature sensors to record the temperature from the inside and outside of my flat.

While I saw the csv files fill up over the months I tried to find a good use for the data. At first I was looking for private weather clusters where people can contribute local (up to date) temperature data but I didn't find a page like that.

I also tried to code a temperature prediction algorithm that could tell me how the weather will develop but that would need years of data and I only got a few months.

So I went another way: I made a HTML5 canvas page that visualized the data and colored it from blue (cold) to red (hot)

This "sunset" was the result:


This sunset is made out of small boxes where every box stands for a measured temperature. Note that this is actually a 2D representation of 1 dimensional data (it should be a long line but is rendered as 2D. The color of the box is calculated by a temperature scale. At first the script looks for the lowest and the highest temperatures and uses them as scale for every temperature and calculates the color. The size of every box is calculated by how many temperature entries there are and how big your screen is.

You can really see the heatweave in the beginning (July and August) and even in the heat you can see when it started raining (the colder boxes).

A fun thing I can do is tell the script how detailed it should render. The picture above is rendered with a detail of 10 (which actually means just that I just use every 10th temperature to create a box)

The following render has a detail of 100 but even though it has a lower detail value you can see day/night cycles much better.


In comparison detail 1 (the highest detail level) has too much information to be readable


And just for fun the inside temperature rendered in detail 10. Note that the temperature scale for this is different. Red and blue don't mean the same temperatures as in the outside temperature graph since the color levels are calculated by lowest/highest from the data at hand.


You can find the live version here. You can click on any box on the screen and it will show you when it was and what the temperature was. It also has to process the big csv file which is why it could take a few seconds to load.

For the geeks:

The color calculation function
function getColor(temperature)
{
 var t = warmest+coldest; //warmest and coldest were set at loading
 var red = (255 * (temperature / t));
 var green = 0;
 var blue = 255 - (255 * (temperature / t));

 return 'rgb(' + Math.round(red) + ',' + Math.round(green) + ',' + Math.round(blue) + ')'; 
}